Editor's Note: Although Florida has seen the most impressive growth in the chart below, just behind Arizona's Lake Havasu City-Kingman region is the Prescott Valley-Prescott, Arizona area. Even though the factors highlighted in Prickly Pear in 2020 and 2022 have turned Arizona's politics and elections purple, Arizona remains a state with a strong focus on America and individual freedom, especially economic opportunity and constitutional amendments. It continues to be a great model for Article 2 rights.
At least 27 million Americans have immigrated each year since government record-keeping began in 1948. The reasons why individuals and families decide to migrate are often personal. This includes things like getting closer to relatives, starting a new relationship, or needing a larger home.
But many regions of the country have the advantage of having more universal appeal, and some of these regions have seen population booms over the past year.
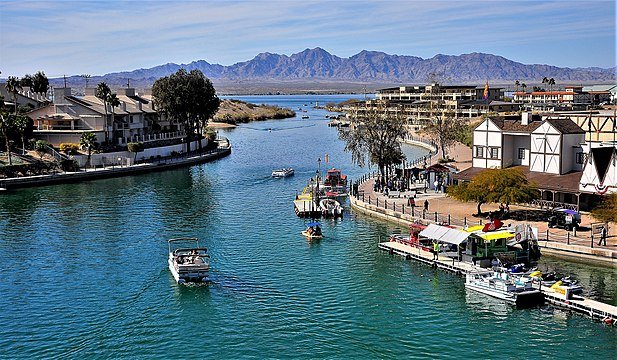
According to data from the U.S. Census Bureau's Population Estimates Program. People are flocking to the Lake Havasu City and Kingman metro areas in Arizona. From July 1, 2021 to June 30, 2022, the number of people moving into the region exceeded the number of people moving out by approximately 6,140.
Its annual population growth rate of 2.8% due to net migration alone, excluding births and deaths, was the 19th largest increase among all 387 metropolitan areas in the United States.
All data used in this article were aggregated from the county level to the metropolitan level using the Census Bureau's July 2023 definition of metropolitan statistical areas.
| rank | metropolitan area | pop. Increase from net immigration, July 2021 to June 2022 (%) | pop.Increase from net immigration, July 2021 to June 2022 |
|---|---|---|---|
| 1 | Wildwood, Florida – The Villages | 8.7% | 11,680 |
| 2 | Myrtle Beach-Conway-North Myrtle Beach, SC | 4.9% | 18,100 |
| 3 | Punta Gorda, Florida | 4.9% | 9,520 |
| Four | Lakeland, Florida – Winter Haven | 4.2% | 31,960 |
| Five | Homosassa Springs, Florida | 4.1% | 6,550 |
| 6 | Cape Coral – Fort Myers, Florida | 4.1% | 32,420 |
| 7 | Northport-Bradenton-Sarasota, FL | 3.9% | 33,900 |
| 8 | Wilmington, North Carolina | 3.7% | 16,240 |
| 9 | Ocala, Florida | 3.6% | 14,030 |
| Ten | Port Saint Lucie, Florida | 3.5% | 17,780 |
| 11 | Deltona – Daytona Beach – Ormond Beach, FL | 3.4% | 23,200 |
| 12 | Sebring, Florida | 3.4% | 3,460 |
| 13 | Panama City – Panama City Beach, Florida | 3.2% | 6,450 |
| 14 | Daphne Fairhope Foley, Alabama | 3.0% | 7,300 |
| 15 | Marco Island, Naples, Florida | 3.0% | 11,540 |
| 16 | St. George, Utah | 2.9% | 5,640 |
| 17 | Sebastian – Vero Beach – West Vero Corridor, FL | 2.9% | 4,780 |
| 18 | Spartanburg, South Carolina | 2.9% | 10,470 |
| 19 | Lake Havasu City – Kingman, Arizona | 2.8% | 6,140 |
| 20 | Palm Bay, Florida – Melbourne – Titusville | 2.7% | 16,460 |
| twenty one | Lansing – East Lansing, Michigan | 2.6% | 12,030 |
| twenty two | Hilton Head Island – Bluffton – Port Royal, SC | 2.6% | 5,790 |
| twenty three | Sherman Denison, Texas | 2.6% | 3,620 |
| twenty four | Pinehurst, North Carolina – Southern Pines | 2.6% | 2,650 |
| twenty five | Prescott Valley – Prescott, Arizona | 2.5% | 5,990 |
*****
This article Published by center square Reprinted with permission.
Image credit: Wikipedia